Download this example
Download this example as a Jupyter Notebook or as a Python script.
Graphic card thermal analysis#
This example shows how to use pyAEDT to create a graphic card setup in Icepak and postprocess the results. The example file is an Icepak project with a model that is already created and has materials assigned.
Keywords: Icepak, boundary conditions, postprocessing, monitors.
Perform imports and define constants#
Perform required imports.
[1]:
import os
import tempfile
import time
import ansys.aedt.core
import pandas as pd
from ansys.aedt.core.examples.downloads import download_icepak
from IPython.display import Image
Define constants.
[2]:
AEDT_VERSION = "2026.1"
NUM_CORES = 4
NG_MODE = False # Do not show the graphical user interface.
Create temporary directory and download project#
Create a temporary directory where downloaded data or dumped data can be stored. If you’d like to retrieve the project data for subsequent use, the temporary folder name is given by temp_folder.name.
[3]:
temp_folder = tempfile.TemporaryDirectory(suffix=".ansys")
project_temp_name = download_icepak(local_path=temp_folder.name)
Open project#
Open the project without the GUI.
[4]:
ipk = ansys.aedt.core.Icepak(
project=project_temp_name,
version=AEDT_VERSION,
new_desktop=True,
non_graphical=NG_MODE,
)
PyAEDT INFO: Parsing C:\Users\ansys\AppData\Local\Temp\tmp2sbg8o90.ansys\Graphics_card.aedt.
PyAEDT INFO: Python version 3.10.11 (tags/v3.10.11:7d4cc5a, Apr 5 2023, 00:38:17) [MSC v.1929 64 bit (AMD64)].
PyAEDT INFO: PyAEDT version 1.3.dev0.
PyAEDT INFO: Initializing new Desktop session.
PyAEDT INFO: AEDT version 2026.1.
PyAEDT INFO: File C:\Users\ansys\AppData\Local\Temp\tmp2sbg8o90.ansys\Graphics_card.aedt correctly loaded. Elapsed time: 0m 0sec
PyAEDT INFO: New AEDT session is starting on gRPC port 51318.
PyAEDT INFO: Starting new AEDT gRPC session on port 51318.
PyAEDT INFO: Launching AEDT server with gRPC transport mode: wnua
PyAEDT INFO: Electronics Desktop started on gRPC port 51318 after 10.1 seconds.
PyAEDT INFO: AEDT installation Path C:\Program Files\ANSYS Inc\v261\AnsysEM
PyAEDT INFO: 2026.1 version started with process ID 3656.
PyAEDT INFO: Non-graphical mode detected. Disabling Desktop logs.
PyAEDT INFO: Project Graphics_card has been opened.
PyAEDT INFO: Active Design set to IcepakDesign1
PyAEDT INFO: AEDT objects correctly read
Plot model and rotate#
Plot the model using the pyAEDT-PyVista integration and save the result to a file. Rotate the model and plot the rotated model again.
[5]:
plot1 = ipk.plot(
show=False,
output_file=os.path.join(temp_folder.name, "Graphics_card_1.jpg"),
plot_air_objects=False,
)
ipk.modeler.rotate(ipk.modeler.object_names, "X")
plot2 = ipk.plot(
show=False,
output_file=os.path.join(temp_folder.name, "Graphics_card_2.jpg"),
plot_air_objects=False,
)
PyAEDT INFO: PostProcessor class has been initialized! Elapsed time: 0m 0sec
PyAEDT INFO: Post class has been initialized! Elapsed time: 0m 0sec
PyAEDT INFO: Modeler class has been initialized! Elapsed time: 0m 0sec
C:\actions-runner\_work\pyaedt-examples\pyaedt-examples\.venv\lib\site-packages\ansys\aedt\core\visualization\plot\pyvista.py:1366: PyVistaDeprecationWarning: ``Plotter.button_widgets`` is deprecated; use ``Plotter.widgets.button_widgets`` instead.
while len(self.plot.button_widgets) > 1:
C:\actions-runner\_work\pyaedt-examples\pyaedt-examples\.venv\lib\site-packages\ansys\aedt\core\visualization\plot\pyvista.py:1366: PyVistaDeprecationWarning: ``Plotter.button_widgets`` is deprecated; use ``Plotter.widgets.button_widgets`` instead.
while len(self.plot.button_widgets) > 1:
Define boundary conditions#
Create source blocks on the CPU and memories.
[6]:
ipk.assign_solid_block(object_name="CPU", power_assignment="25W")
ipk.assign_solid_block(object_name=["MEMORY1", "MEMORY1_1"], power_assignment="5W")
PyAEDT INFO: Boundary Block Block_8GTXQL has been created.
PyAEDT INFO: Boundary Block Block_53KS43 has been created.
[6]:
Block_53KS43
The air region object handler is used to specify the inlet (fixed velocity condition) and outlet (fixed pressure condition) at x_max and x_min.
[7]:
region = ipk.modeler["Region"]
ipk.assign_pressure_free_opening(assignment=region.top_face_x.id, boundary_name="Outlet")
ipk.assign_velocity_free_opening(
assignment=region.bottom_face_x.id,
boundary_name="Inlet",
velocity=["1m_per_sec", "0m_per_sec", "0m_per_sec"],
)
PyAEDT INFO: Boundary Opening Outlet has been created.
PyAEDT INFO: Boundary Opening Inlet has been created.
[7]:
Inlet
Assign mesh settings#
Assign mesh region#
Assign a mesh region around the heat sink and CPU.
[8]:
mesh_region = ipk.mesh.assign_mesh_region(assignment=["HEAT_SINK", "CPU"])
PyAEDT WARNING: Property Command is read-only.
PyAEDT INFO: Mesh class has been initialized! Elapsed time: 0m 0sec
PyAEDT WARNING: Property Command is read-only.
PyAEDT WARNING: Property Command is read-only.
Print the available settings for the mesh region
[9]:
mesh_region.settings
[9]:
{'EnforceCutCellMeshing': False, 'OptimizePCBMesh': True, 'StairStepMeshing': False, 'MeshMethod': 'MesherHD', 'GeometryBasedMeshing': True, 'ProximitySizeFunction': True, 'Enforce2dot5DCutCell': False, 'EnableTransition': False, 'ComputeGap': True, 'Enable2DCutCell': False, 'FacetLevel': 3, 'CurvatureSizeFunction': True, 'MeshRegionResolution': 5}
Set the mesh region settings to manual and see newly available settings.
[10]:
mesh_region.manual_settings = True
mesh_region.settings
[10]:
{'EnforceCutCellMeshing': False, 'MinGapX': '1mm', 'UniformMeshParametersType': 'Average', 'MinGapY': '1mm', 'BufferLayers': '0', 'MinElementsInGap': '3', 'ComputeGap': True, 'Enable2DCutCell': False, 'MaxElementSizeX': '0.02mm', 'MaxElementSizeZ': '0.03mm', 'CurvatureSizeFunction': True, 'OptimizePCBMesh': True, 'StairStepMeshing': False, 'MinElementsOnEdge': '2', 'EnforeMLMType': '3D', 'MinGapZ': '1mm', 'MeshMethod': 'MesherHD', 'MaxLevels': '0', 'ProximitySizeFunction': True, 'NoOGrids': False, 'Enforce2dot5DCutCell': False, 'EnableTransition': False, 'MaxSizeRatio': '2', '2DMLMType': '2DMLM_None', 'MaxElementSizeY': '0.02mm', 'EnableMLM': True}
Modify settings and update.
[11]:
mesh_region.settings["MaxElementSizeX"] = "2mm"
mesh_region.settings["MaxElementSizeY"] = "2mm"
mesh_region.settings["MaxElementSizeZ"] = "2mm"
mesh_region.settings["EnableMLM"] = True
mesh_region.settings["MaxLevels"] = "2"
mesh_region.settings["MinElementsInGap"] = 4
mesh_region.update()
[11]:
True
Modify the slack of the subregion around the objects.
[12]:
subregion = mesh_region.assignment
subregion.positive_x_padding = "20mm"
subregion.positive_y_padding = "5mm"
subregion.positive_z_padding = "5mm"
subregion.negative_x_padding = "5mm"
subregion.negative_y_padding = "5mm"
subregion.negative_z_padding = "10mm"
PyAEDT WARNING: Property Command is read-only.
PyAEDT WARNING: Property Command is read-only.
PyAEDT WARNING: Property Command is read-only.
PyAEDT WARNING: Property Command is read-only.
PyAEDT WARNING: Property Command is read-only.
PyAEDT WARNING: Property Command is read-only.
PyAEDT WARNING: Property Command is read-only.
PyAEDT WARNING: Property Command is read-only.
PyAEDT WARNING: Property Command is read-only.
PyAEDT WARNING: Property Command is read-only.
PyAEDT WARNING: Property Command is read-only.
PyAEDT WARNING: Property Command is read-only.
Assign monitors#
Assign a temperature face monitor to the CPU face in contact with the heatsink.
[13]:
cpu = ipk.modeler["CPU"]
m1 = ipk.monitor.assign_face_monitor(
face_id=cpu.top_face_z.id,
monitor_quantity="Temperature",
monitor_name="TemperatureMonitor1",
)
Assign multiple speed point monitors downstream of the assembly.
[14]:
speed_monitors = []
for x_pos in range(0, 10, 2):
m = ipk.monitor.assign_point_monitor(point_position=[f"{x_pos}mm", "40mm", "15mm"], monitor_quantity="Speed")
speed_monitors.append(m)
Solve project#
Create a setup, modify solver settings, and run the simulation.
[15]:
setup1 = ipk.create_setup()
setup1.props["Flow Regime"] = "Turbulent"
setup1.props["Convergence Criteria - Max Iterations"] = 5
setup1.props["Linear Solver Type - Pressure"] = "flex"
setup1.props["Linear Solver Type - Temperature"] = "flex"
ipk.save_project()
ipk.analyze(setup=setup1.name, cores=NUM_CORES, tasks=NUM_CORES)
PyAEDT INFO: Project Graphics_card Saved correctly
PyAEDT INFO: Project Graphics_card Saved correctly
PyAEDT INFO: Key Desktop/ActiveDSOConfigurations/Icepak correctly changed.
PyAEDT INFO: Solving design setup Setup
PyAEDT INFO: Design setup Setup solved correctly in 0.0h 3.0m 37.0s
PyAEDT INFO: Key Desktop/ActiveDSOConfigurations/Icepak correctly changed.
[15]:
True
Postprocess#
Perform quantitative postprocessing#
Get the point monitor data. A dictionary is returned with 'Min', 'Max', and 'Mean' keys.
[16]:
temperature_data = ipk.post.evaluate_monitor_quantity(monitor=m1, quantity="Temperature")
temperature_data
[16]:
{'Min': '58.7474',
'Max': '58.7474',
'Mean': '58.7474',
'Stdev': '0',
'Unit': 'C'}
It is also possible to get the data as a Pandas dataframe for advanced postprocessing.
[17]:
speed_fs = ipk.post.create_field_summary()
for m_name in speed_monitors:
speed_fs.add_calculation(entity="Monitor", geometry="Volume", geometry_name=m_name, quantity="Speed")
speed_data = speed_fs.get_field_summary_data(pandas_output=True)
All the data is now in a dataframe, making it easy to visualize and manipulate.
[18]:
speed_data.head()
[18]:
| Entity Type | Geometry Type | Entity | Quantity | Side | Normal | Mesh | Min | Max | Mean | Stdev | Area/Volume | Variation | |
|---|---|---|---|---|---|---|---|---|---|---|---|---|---|
| 0 | Monitor | Volume | Monitor_4KWHCG | Speed[m/s] | Default | All | 0.246147 | 0.246147 | 0.246147 | 0 | 0 m^3 | ||
| 1 | Monitor | Volume | Monitor_1V53U0 | Speed[m/s] | Default | All | 0.262477 | 0.262477 | 0.262477 | 0 | 0 m^3 | ||
| 2 | Monitor | Volume | Monitor_CFYOQ2 | Speed[m/s] | Default | All | 0.330020 | 0.330020 | 0.330020 | 0 | 0 m^3 | ||
| 3 | Monitor | Volume | Monitor_49D1OE | Speed[m/s] | Default | All | 0.337701 | 0.337701 | 0.337701 | 0 | 0 m^3 | ||
| 4 | Monitor | Volume | Monitor_2QQALW | Speed[m/s] | Default | All | 0.345574 | 0.345574 | 0.345574 | 0 | 0 m^3 |
The speed_data dataframe contains data from monitors, so it can be expanded with information of their position.
[19]:
for i in range(3):
direction = ["X", "Y", "Z"][i]
speed_data["Position" + direction] = [ipk.monitor.all_monitors[entity].location[i] for entity in speed_data["Entity"]]
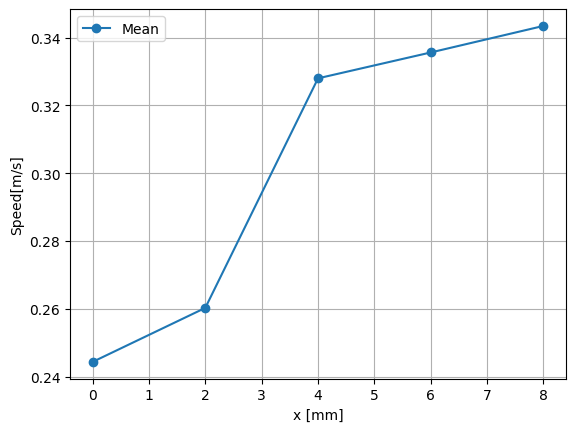
Plot the velocity profile at different X positions
[20]:
speed_data.plot(
x="PositionX",
y="Mean",
kind="line",
marker="o",
ylabel=speed_data.at[0, "Quantity"],
xlabel=f"x [{ipk.modeler.model_units}]",
grid=True,
)
[20]:
<Axes: xlabel='x [mm]', ylabel='Speed[m/s]'>
Extract temperature data at those same locations (so the speed_monitors list is used).
[21]:
temperature_fs = ipk.post.create_field_summary()
for m_name in speed_monitors:
temperature_fs.add_calculation(
entity="Monitor",
geometry="Volume",
geometry_name=m_name,
quantity="Temperature",
)
temperature_fs = temperature_fs.get_field_summary_data(pandas_output=True)
temperature_fs.head()
[21]:
| Entity Type | Geometry Type | Entity | Quantity | Side | Normal | Mesh | Min | Max | Mean | Stdev | Area/Volume | Variation | |
|---|---|---|---|---|---|---|---|---|---|---|---|---|---|
| 0 | Monitor | Volume | Monitor_4KWHCG | Temperature[C] | Default | All | 55.6153 | 55.6153 | 55.6153 | 0 | 0 m^3 | ||
| 1 | Monitor | Volume | Monitor_1V53U0 | Temperature[C] | Default | All | 51.8916 | 51.8916 | 51.8916 | 0 | 0 m^3 | ||
| 2 | Monitor | Volume | Monitor_CFYOQ2 | Temperature[C] | Default | All | 46.2304 | 46.2304 | 46.2304 | 0 | 0 m^3 | ||
| 3 | Monitor | Volume | Monitor_49D1OE | Temperature[C] | Default | All | 45.5435 | 45.5435 | 45.5435 | 0 | 0 m^3 | ||
| 4 | Monitor | Volume | Monitor_2QQALW | Temperature[C] | Default | All | 44.8566 | 44.8566 | 44.8566 | 0 | 0 m^3 |
The two dataframes can be merged using the pd.merge() function. With the merge, suffixes are added to the column names to differentiate between the columns from each original dataframe.
[22]:
merged_df = pd.merge(temperature_fs, speed_data, on="Entity", suffixes=("_temperature", "_speed"))
merged_df.head()
[22]:
| Entity Type_temperature | Geometry Type_temperature | Entity | Quantity_temperature | Side_temperature | Normal_temperature | Mesh_temperature | Min_temperature | Max_temperature | Mean_temperature | ... | Mesh_speed | Min_speed | Max_speed | Mean_speed | Stdev_speed | Area/Volume_speed | Variation_speed | PositionX | PositionY | PositionZ | |
|---|---|---|---|---|---|---|---|---|---|---|---|---|---|---|---|---|---|---|---|---|---|
| 0 | Monitor | Volume | Monitor_4KWHCG | Temperature[C] | Default | All | 55.6153 | 55.6153 | 55.6153 | ... | All | 0.246147 | 0.246147 | 0.246147 | 0 | 0 m^3 | 0.0 | 40.0 | 15.0 | ||
| 1 | Monitor | Volume | Monitor_1V53U0 | Temperature[C] | Default | All | 51.8916 | 51.8916 | 51.8916 | ... | All | 0.262477 | 0.262477 | 0.262477 | 0 | 0 m^3 | 2.0 | 40.0 | 15.0 | ||
| 2 | Monitor | Volume | Monitor_CFYOQ2 | Temperature[C] | Default | All | 46.2304 | 46.2304 | 46.2304 | ... | All | 0.330020 | 0.330020 | 0.330020 | 0 | 0 m^3 | 4.0 | 40.0 | 15.0 | ||
| 3 | Monitor | Volume | Monitor_49D1OE | Temperature[C] | Default | All | 45.5435 | 45.5435 | 45.5435 | ... | All | 0.337701 | 0.337701 | 0.337701 | 0 | 0 m^3 | 6.0 | 40.0 | 15.0 | ||
| 4 | Monitor | Volume | Monitor_2QQALW | Temperature[C] | Default | All | 44.8566 | 44.8566 | 44.8566 | ... | All | 0.345574 | 0.345574 | 0.345574 | 0 | 0 m^3 | 8.0 | 40.0 | 15.0 |
5 rows × 28 columns
The column names are renamed based on the Quantity column of the original dataframes. Finally, only the 'Entity', 'Mean_temperature', and 'Mean_speed' columns are selected and assigned to the merged dataframe.
[23]:
temperature_quantity = temperature_fs["Quantity"].iloc[0]
velocity_quantity = speed_data["Quantity"].iloc[0]
merged_df.rename(
columns={"Mean_temperature": temperature_quantity, "Mean_speed": velocity_quantity},
inplace=True,
)
merged_df = merged_df[
[
"Entity",
temperature_quantity,
velocity_quantity,
"PositionX",
"PositionY",
"PositionZ",
]
]
merged_df.head()
[23]:
| Entity | Temperature[C] | Speed[m/s] | PositionX | PositionY | PositionZ | |
|---|---|---|---|---|---|---|
| 0 | Monitor_4KWHCG | 55.6153 | 0.246147 | 0.0 | 40.0 | 15.0 |
| 1 | Monitor_1V53U0 | 51.8916 | 0.262477 | 2.0 | 40.0 | 15.0 |
| 2 | Monitor_CFYOQ2 | 46.2304 | 0.330020 | 4.0 | 40.0 | 15.0 |
| 3 | Monitor_49D1OE | 45.5435 | 0.337701 | 6.0 | 40.0 | 15.0 |
| 4 | Monitor_2QQALW | 44.8566 | 0.345574 | 8.0 | 40.0 | 15.0 |
Compute the correlation coefficient between velocity and temperature from the merged dataframe and plot a scatter plot to visualize their relationship.
[24]:
correlation = merged_df[velocity_quantity].corr(merged_df[temperature_quantity])
ax = merged_df.plot.scatter(x=velocity_quantity, y=temperature_quantity)
ax.set_xlabel(velocity_quantity)
ax.set_ylabel(temperature_quantity)
ax.set_title(f"Correlation between Temperature and Velocity: {correlation:.2f}")
[24]:
Text(0.5, 1.0, 'Correlation between Temperature and Velocity: -0.99')
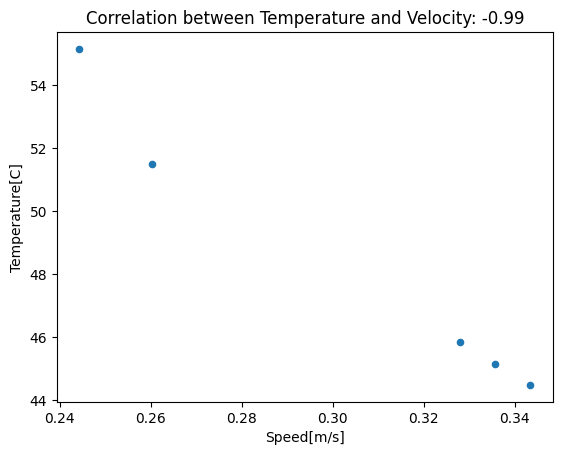
The further away from the assembly, the faster and colder the air due to mixing. Despite being extremely simple, this example demonstrates the potential of importing field summary data into Pandas.
Perform qualitative Postprocessing#
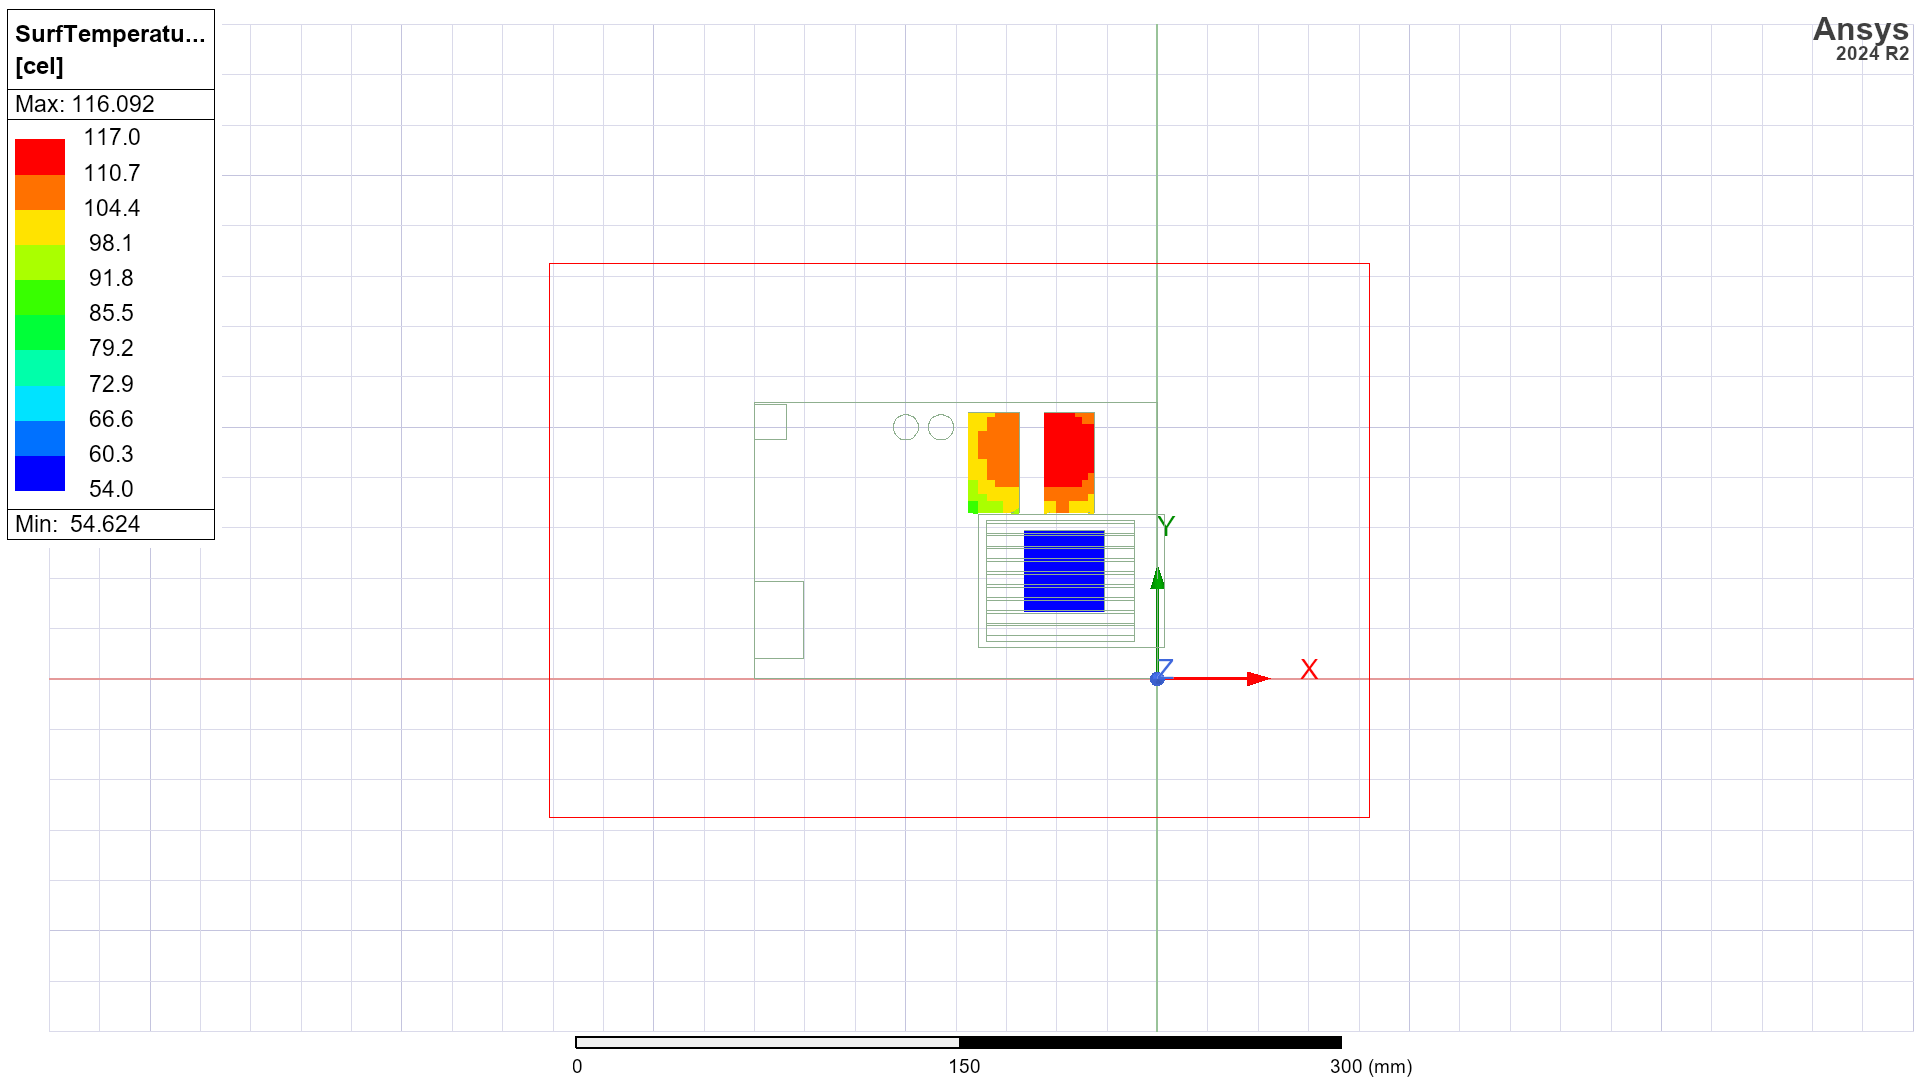
Create a temperature plot on main components and export it to a PNG file.
[25]:
surflist = [i.id for i in ipk.modeler["CPU"].faces]
surflist += [i.id for i in ipk.modeler["MEMORY1"].faces]
surflist += [i.id for i in ipk.modeler["MEMORY1_1"].faces]
plot3 = ipk.post.create_fieldplot_surface(assignment=surflist, quantity="SurfTemperature")
path = plot3.export_image(
full_path=os.path.join(temp_folder.name, "temperature.png"),
orientation="top",
show_region=False,
)
Image(filename=path) # Display the image
PyAEDT INFO: Active Design set to IcepakDesign1
[25]:
Use PyVista to display the temperature map.
[26]:
plot4 = ipk.post.plot_field(
quantity="Temperature",
assignment=[
"SERIAL_PORT",
"MEMORY1",
"MEMORY1_1",
"CAPACITOR",
"CAPACITOR_1",
"KB",
"HEAT_SINK",
"CPU",
"ALPHA_MAIN_PCB",
],
plot_cad_objs=False,
show=False,
export_path=temp_folder.name,
)
PyAEDT INFO: Active Design set to IcepakDesign1
C:\actions-runner\_work\pyaedt-examples\pyaedt-examples\.venv\lib\site-packages\ansys\aedt\core\visualization\plot\pyvista.py:1366: PyVistaDeprecationWarning: ``Plotter.button_widgets`` is deprecated; use ``Plotter.widgets.button_widgets`` instead.
while len(self.plot.button_widgets) > 1:
Release AEDT#
[27]:
ipk.save_project()
ipk.release_desktop()
# Wait 3 seconds to allow AEDT to shut down before cleaning the temporary directory.
time.sleep(3)
PyAEDT INFO: Project Graphics_card Saved correctly
PyAEDT INFO: Desktop has been released and closed.
Clean up#
All project files are saved in the folder temp_folder.name. If you’ve run this example as a Jupyter notebook, you can retrieve those project files. The following cell removes all temporary files, including the project folder.
[28]:
temp_folder.cleanup()
Download this example
Download this example as a Jupyter Notebook or as a Python script.